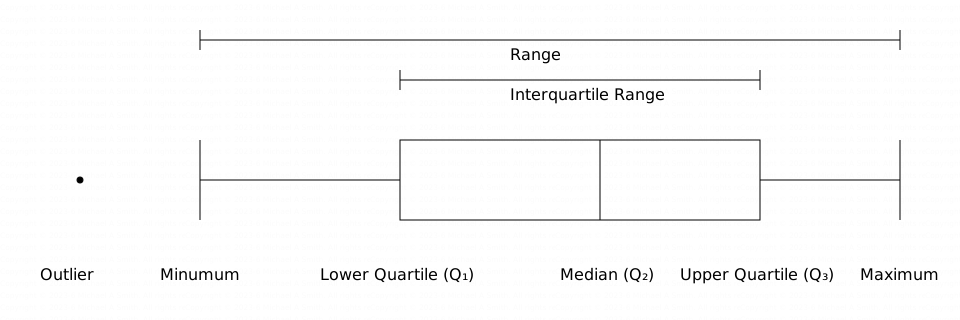
A box plot is formed from a horizontally elongated rectangle with a vertical lines positioned within it. At each end are horizontal lines with vertical end stops. Each vertical line represents an important values within the data set: lowest, lower quartile, median, upper quartile, highest. Outliers will be indicated beyond the end stops by dots or crosses. Box plots are a useful visualisation of the spread of a data set and for comparing data sets.
- Box Plots
-
Box plot
(Care of thirdspacelearning.com) -
Box plot
(Care of www.mathsgenie.co.uk) -
Box plot
(Care of mmerevise.co.uk) - Box plots- draw/interpret Video
- Practice Questions
- Textbook Exercise
- (Care of corbettmaths.com)
- Box plots (compared) Video
- Practice Questions
- Textbook Exercise
- (Care of corbettmaths.com)