There are various ways of displaying or calculating the spread, or variation, of a collection of data. From the simpliest to calculate, range, to those summarising all the data, standard deviation. Displays of the distribution of the data can be completed quickly ising stem-and-leaf diagrams or in more detail using frequency density plots, or histograms.
Range
(a measure of spread)
The difference between the highest and lowest elements.
Example:
The set
has a highest value of 45 and lowest value of 13 therefore the range is .
For group data, an estimate of the range can be worked out using
Example:
| Fish Length / cm | Frequency |
|---|---|
| 1 - 10 | 1 |
| 11 - 20 | 7 |
| 21 - 30 | 5 |
| 31 - 40 | 4 |
| 41 - 50 | 3 |
Here the is and the is so the range is 49.
- Range Video
- Range (frequency tables) Video
- Practice Questions
- Textbook Exercise
- (Care of corbettmaths.com)
Questions
(Care of thirdspacelearning.com)
IQR - interquartile range
Stem & Leaf Diagrams
Histograms
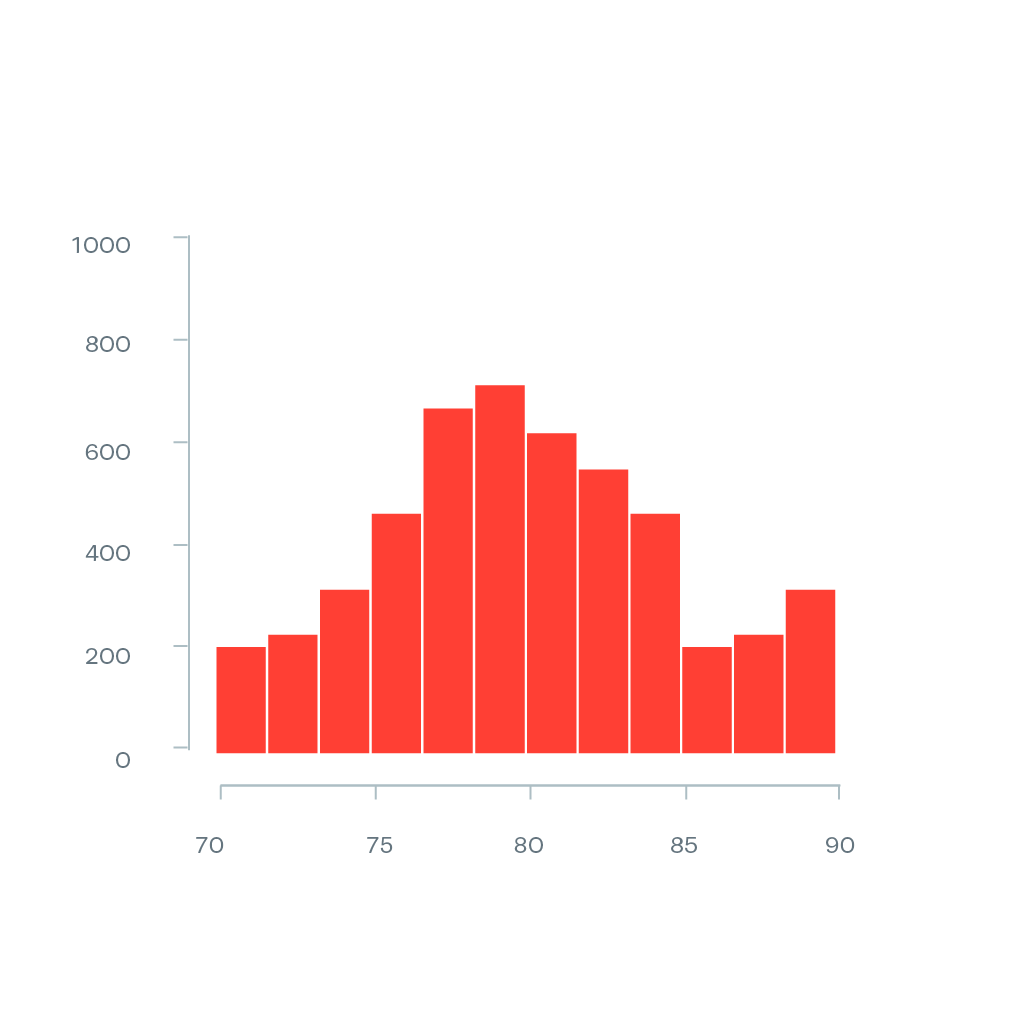
Videos and Questions:
- Graphs: histograms (draw) Video:
- Graphs: histograms (interpret) Video:
- Graphs: histograms harder Video:
- Practice Questions;
- Textbook Exercise.
- Textbook Exercise.
- (Care of corbettmaths.com)
- Histograms:
- Questions [ MS ].
- (Care of www.mathsgenie.co.uk)
Histograms - GCSE Maths - Steps, Examples & Worksheet
(Care of thirdspacelearning.com)
Histograms - Math is Fun
(Care of www.mathsisfun.com)
Histograms | Edexcel A Level Maths: Statistics Revision Notes 2018
(Care of www.savemyexams.com)
Search for GCSE Maths Histograms
Search for A Level Maths Histograms
Cumulative Frequency Graphs
Cumulative Frequency Graphs Worksheet [ MS ];
Box Plots
Normal Distibution
Variance and Standard Deviation - measures of spread:
or "the standard deviation is the mean of the square minus the square of the mean".