Outliers
(comparison between an element and the rest of the set)
An outlier is an extreme data value that doesn't fit the overall pattern.
Example:
The set has a mean of 34 and the range for the data given is 32. One data point to not close to this mean, i.e., 13. If we remove 13 (as it looks like an outlier) the mean is 37 and the range is now 14, so removing what looks like an outlier has little effect on the mean but changes the range considerably. To reject the outlier completely we must look at the context in which the data was collected to confirm why it doesn't fit the same pattern.
Further Reading
Hypothesis Testing
Two Groups of Data?
(Comparison between two sets of data)
To compare two (or more) sets of data, compare the averages (mean, median or mode) and the Spread (range or IQR) of the sets.
Example:
Set A has a mean of 44.5 and range of 28.
Set B has a mean of 28 and range of 96.
It can be seen that set A is both higher on average and more consistent (lower range)
Correlation
Regression
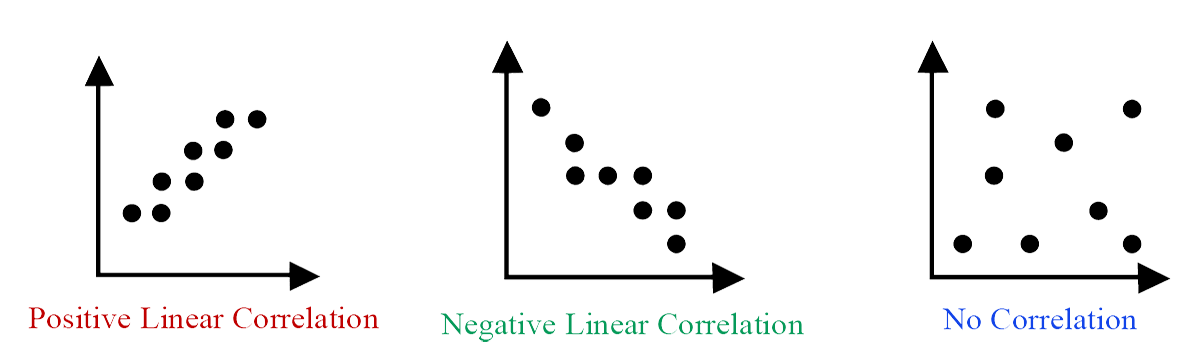
Bivariate data is data in which there are pairs of values for two variables. Correlation describes the nature of the linear relationship between the two variables. When two variables are correlated, consideration of the context of the situation and reason to determine whether the variables have a causal relationship. The regression line of versus can be written in the form . The coefficient b tells us for each unit change in . If the data is positively correlated, will be positive. If the data is negatively correlated, will be negative. Predictions should only be made for values of the dependent variable that are within the range of the given independant variable.
- If for constants and then ;
- If for constants and then (see linearisation);
- The product moment correlation coefficient describes the linear correlation between two variables. It can take values between -1 and 1.
-
For a one-tailed hypothesis test use either:
or
For a two-tailed test use:
-
Compare the calcaulated product moment correlation coefficient with critical values in the table below:
If the magnitude of the calculated PMCC is greater than the critical value then we accept the alternate hypothesis and reject the null hypothesis. The reverse is accepted if the it is less than.